Takeaways from China’s remarkable economic growth numbers
According to official statistics and analysts, China might have been one of the only major countries to see economic growth in 2020 after taking a hit from COVID-19 early in the year. That growth streak, even during a pandemic, has continued into January 2021.

China’s GDP exceeded 100 trillion yuan ($15.47 trillion) for the first time in 2020, an increase of 2.3%, according to (in Chinese) the National Bureau of Statistics (NBS). Analysts said that China might be the only major economic entity that saw economic growth in 2020. According to economic surveys, that growth has continued into January 2021, particularly in exports.
Below are some of the details from China’s economic statistics in 2020:
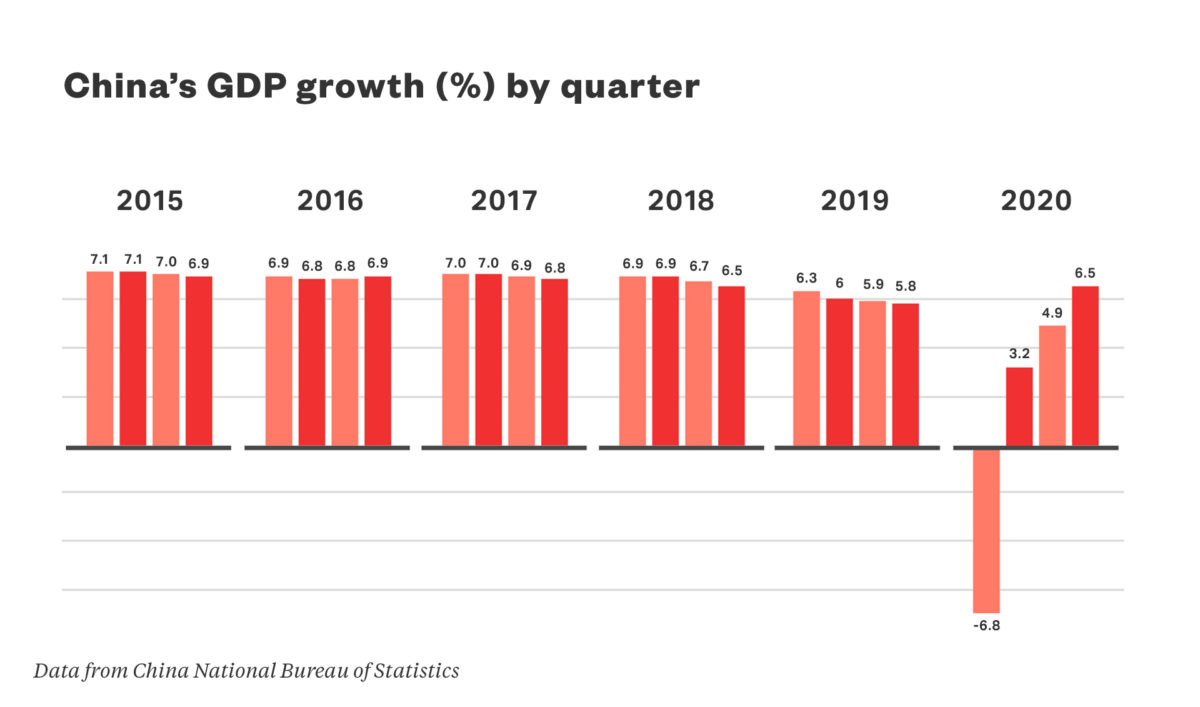
GDP growth by quarter
GDP in the first quarter of 2020 decreased 6.8% year-on-year, but increased in the following quarters with the growth rates of 3.2%, 4.9%, and 6.5%.

The 6.5% GDP growth in the fourth quarter exceeded the growth rates in all quarters in 2019, and also surpassed economists’ expectations in a poll from Reuters.
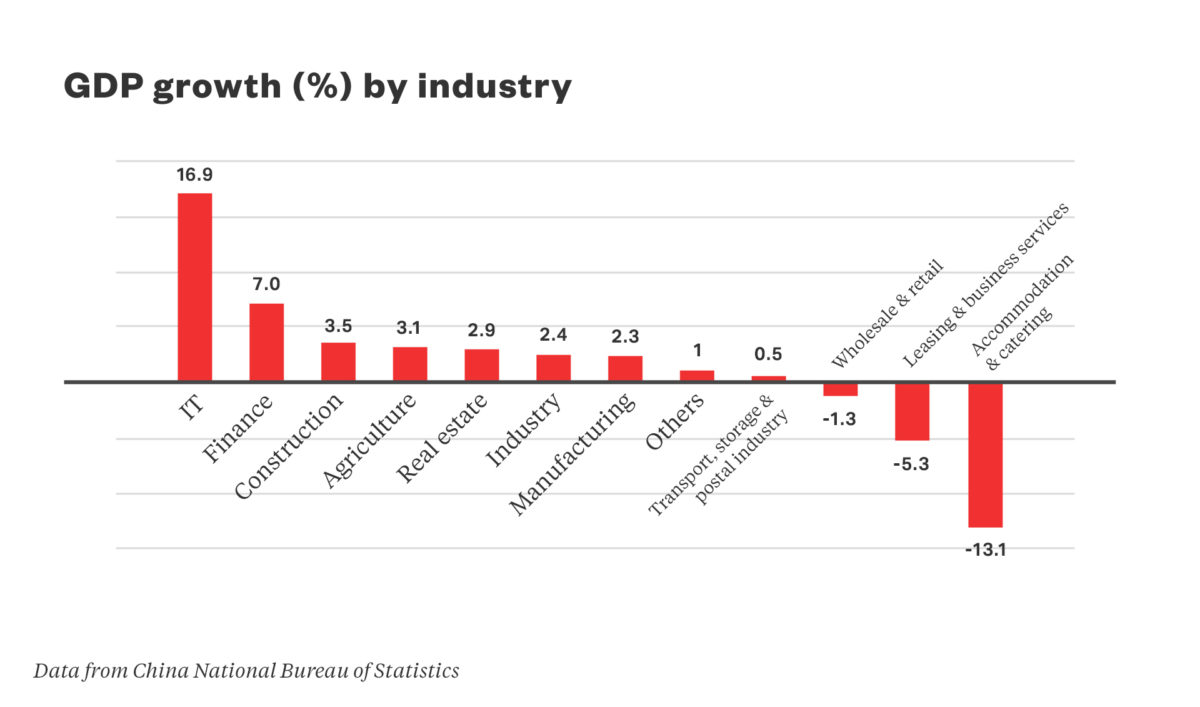
GDP growth by industry
In 2020, the primary sector (agriculture, mining, etc.) grew by 3%, while the secondary sector, which includes manufacturing and construction, saw a 2.6% growth. The tertiary sector — service industries — saw the lowest growth, 2.1%.

The IT industry, followed by the financial industry and construction industry, enjoyed the greatest growth, while the hospitality and catering industries saw the biggest decreases.
Per capita GDP exceeds $10,000
China’s per capita GDP exceeded $10,000 for two consecutive years, according to the People’s Daily. But there remains a gap between China’s high GDP — second only to that of the U.S. — and lower per capita GDP. In 2019, China’s per capita GDP was 26.3% of that of the Euro Area and 15.7% of that of the U.S., according to the World Bank.
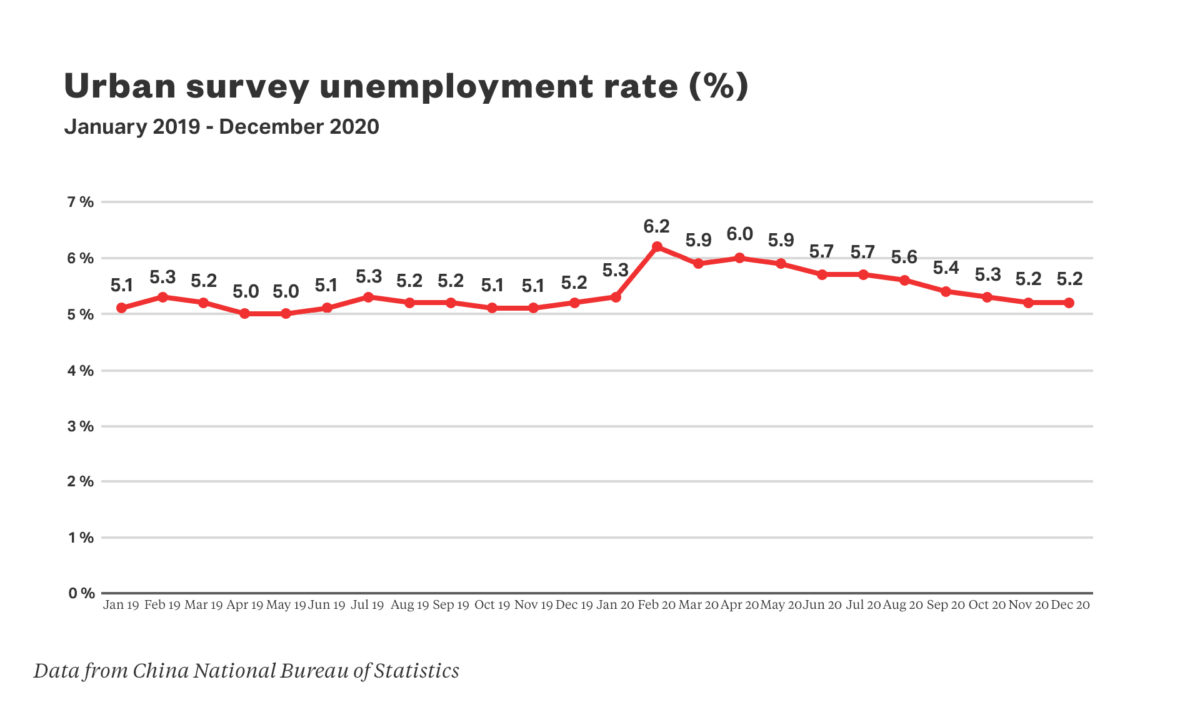
Unemployment
China’s urban survey unemployment rate in December came back to 5.2% after a surge of 6.2% in February 2020. Compared with China, the U.S. unemployment rate also settled down by the end of 2020 to 6.7%, but the peak in the first wave of COVID-19 was also more obvious: In April, the unemployment rate in the U.S. soared to 14.8%, according to the U.S. Bureau of Labor Statistics.

Income and spending
Though the economy grew, Chinese people remained reluctant to spend money.
Adjusted for inflation, per capita disposable income rose 2.1%, but per capita consumption dropped even more, by 4%.
Retail sales dropped 3.9%, but the change was very uneven across sectors. For example, food sales decreased 16.6%, but online retail skyrocketed up 14.8%.
Despite the current spending stinginess, Chinese consumers are still confident about the future. China’s consumer confidence index was on the rise starting from June 2020, according to the data from East Money Information (in Chinese), which reflected the global trend.


