A brief guide to China’s stock markets and indices
From A shares to ChiNext and MSCI’s China index, here is everything you need to know about the global importance of China’s stock markets.

Editor’s note: To mark the launch of the The China Project A.M. newsletter, bringing you China business news in 2 minutes a day, we publish this explainer of China’s stock markets. The indices explained here are the same that we track daily in the newsletter itself. Sign up for free here.
Red is up and green is down
Before we begin, let’s get one thing out of the way:
In China, red arrows point up when prices go up, and green arrows point down when prices go down. This is because red is an auspicious color associated with success and wealth in Chinese culture.
China’s markets — explained
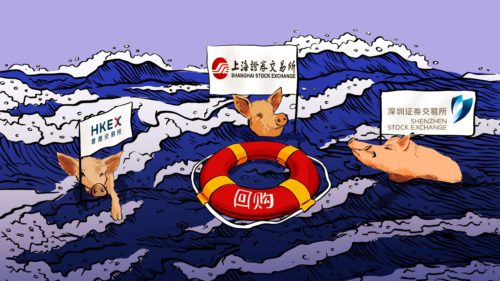
The main places that Chinese companies turn to for capital are the stock exchanges in Shanghai, Shenzhen, and Hong Kong, and the U.S. markets at the New York Stock Exchange and Nasdaq, where Chinese companies can trade American Depositary Receipts (ADRs).
Our The China Project A.M. daily business newsletter includes tracking of all of those markets, via indices based on the performance of Chinese companies listed on them. Below is a brief guide to reading our charts:
A, B, and H shares
China’s stock markets are not easy to invest in for foreign companies and individuals, but certain types of companies are easier than others or involve using different vehicles to access:
- A shares are yuan-denominated shares of China-based companies traded on the Shanghai Stock Exchange and the Shenzhen Stock Exchange;
- B shares are traded in HKD on the Shenzhen Stock Exchange and USD on the Shanghai Stock Exchange;
- H shares are HKD-denominated equity shares of mainland China companies listed on the Hong Kong Stock Exchange.
Shanghai Composite (SSE SHCOMP)
The Shanghai Composite Index (SSE SHCOMP, 上海证券综合指数) is an index based on all companies that trade on the Shanghai Stock Exchange (SSE).
Founded in 1990, SSE is now the largest stock market in China and the fourth largest in the world, after New York Stock Exchange, Nasdaq, and Japan Exchange Group. It mainly hosts large and established Chinese companies, with over 1,800 of them listed, such as state-owned enterprises like oil giant PetroChina and Global 500 companies like liquor producer Kweichow Moutai.
SSE launched the Science and Technology Innovation Board (the STAR Market) in 2019 as an alternative to New York Stock Exchange’s Nasdaq for fast growth companies that could not meet the main board’s requirements for profitability. The STAR Market now hosts promising technology companies, especially those in the semiconductor and biotechnology fields.
The STAR market is included in SHCOMP.
CSI 300 Index (SHSZ300)
The CSI 300 Index (SHSZ300, 沪深300指数) tracks the top 300 companies by capitalization traded on both Shanghai (SSE) and Shenzhen (SZSE) stock exchanges. The CSI 300 is an indicator of the most powerful companies in pillar industries of the Chinese economy, such as energy, finance, and real estate.
Also founded in 1990, in the frontierland of China’s opening up and reform that borders Hong Kong, SZSE is the world’s 9th largest stock exchange. Compared to SSE, stocks listed on SZSE tend to be small- and medium-sized Chinese companies.
SZSE launched the Nasdaq-like ChiNext Market in 2009 to host high-tech startups and small companies. Only a handful of ChiNext stocks have made it to the CSI 300.
Chinext Index (CHINEXT)
ChiNext Index (CHINEXT, 创业板指数) is a collection of the 100 largest and most liquid stocks on the ChiNext Market. The index is a metric for the health of China’s technology startups and emerging industries: More than 90% of the companies listed on the ChiNext board are in the “high-tech” sector.
Hang Seng Index (HSI)
(HSI, 恒生指数) tracks the performances of the blue-chip stocks — i.e. those of large, established companies — listed on the Hong Kong Stock Exchange (HKEX). Created by Hong Kong’s Hang Seng Bank, it is Hong Kong’s equivalent of the Dow Jones.
HKSE, the world’s fifth-largest stock market, is the gateway for Chinese companies to attract foreign investment as well as for Chinese investors to invest in international stocks. HKSE hosts internationally ambitious Chinese companies including tech giants like Tencent and JD.com, as well as a top state-owned oil producer CNOOC.
In 2018, HKSE began allowing dual-class listings, which are popular in the U.S., and allow tech companies to issue two types of stock, which is attractive to tech entrepreneurs who can hang on to the type of stock that has more voting rights while raising funds from investors with no say in how the company is run. Since then, Chinese tech companies have seen HKSE as a strong alternative to the New York Stock Exchange (NYSE) and Nasdaq.
H-share Index (HSCEI)
Hang Seng H-share Index (HSCEI, H股指数) tracks the largest mainland Chinese companies listed in Hong Kong Stock Exchange, and reflects the fortunes of some of China’s biggest companies, including many state-run giants.
MSCI China USD (MSEUSCF)
MSCI China Index USD (MSEUSCF, 中国指数) is composed of nearly 700 stocks of large- and medium-cap Chinese companies trade both domestically and abroad, including in Shanghai, Shenzhen, Hong Kong, and New York.
Created by America’s MSCI, the index offers a comprehensive look at the overall performance of all publicly traded Chinese companies around the world, which other regional stock indices can not cover.
BNY Mellon China ADR $ Index (BKCN)
BNY Mellon China ADR Index (BKCN, 纽约梅隆银行中国ADR指数) tracks the performance of Chinese companies that have American depositary receipts (ADR) that trade on U.S. stock exchanges, including the NYSE Exchange and Nasdaq.
Created by the Bank of New York, the index provides insights on the performance of Chinese companies traded in the U.S. These companies include tech giants such as Alibaba and Baidu, cutting edge firms like passenger drone startup EHang and cancer treatment pioneer Beigene, as well as state-owned behemoths like oil company CNOOC. Their share prices are often swayed by relations between Beijing and Washington.
Sign up for The China Project A.M. to get daily updates on these indices, plus analysis of Chinese-language business news that you won’t find elsewhere. Then, read on for more context on Chinese and global markets.
How China became a financial powers in just 30 years — a brief history
China’s first stock markets began to emerge as early as the 1860s, when foreign businesspeople and companies operated in China’s port cities such as Shanghai, Guangzhou, and Hong Kong. By the early 1900s, Shanghai was the financial center of Asia.
But all of that bourgeois, Western capitalism came to a grinding halt in 1949 when the Communist Party took control of the country under the leadership of Mao Zedong.
China’s stock markets didn’t begin to make a comeback until November 26, 1990, when the Shanghai Stock Exchange was reconstituted by the reform-minded leaders of the day who sought to promote financial innovation and engagement with the global economy.
Interesting fact: Unlike the major Western exchanges which are for-profit corporations that are often themselves publicly traded companies, mainland China’s exchanges are non-profit organizations under the direct control of the China Securities Regulatory Commission, which reports directly to the central government of China. (Hong Kong’s Stock Exchange is, however, run by a company for profit company.)
To #2 spot in record time
The U.S. has the world’s largest equity capital markets, worth $50.1 trillion as of March 5, 2021. But it took the U.S. 229 years to get there.
China has the world’s second-largest equity market, valued at $12.24 trillion. But it took them only 31 years to get there.
And, that number only includes mainland China — the Shanghai and Shenzhen markets, to be specific. If you add in Hong Kong’s $6.5 trillion exchange, the total grows to $18.74 trillion.
So, China’s equity markets are still less than half the size of the U.S. markets, but they’ve gotten there in about 85% less time.
Compare that to the markets of Japan, London and the other major economies and financial markets in the world which have all been in continuous operation for countless decades more than China, and the impressiveness of China’s financial boom and deepening of its markets stands in stark relief.
As of March 5, 2021, major Chinese markets had these total market caps:
- Shanghai: $7 trillion
- Shenzhen: $5.24 trillion
- Hong Kong: $6.5 trillion
- China total: $18.74 trillion
At the same time, major international markets had these total market caps:
- London: $4.15 trillion
- Tokyo: $6.6 trillion
- New York Stock Exchange: $28.53 trillion
- U.S. total: $50.8 trillion
The China Project A.M. is free, and never takes more than 2 minutes to read. Sign up today and keep up with essential business news from China that you won’t find elsewhere.


